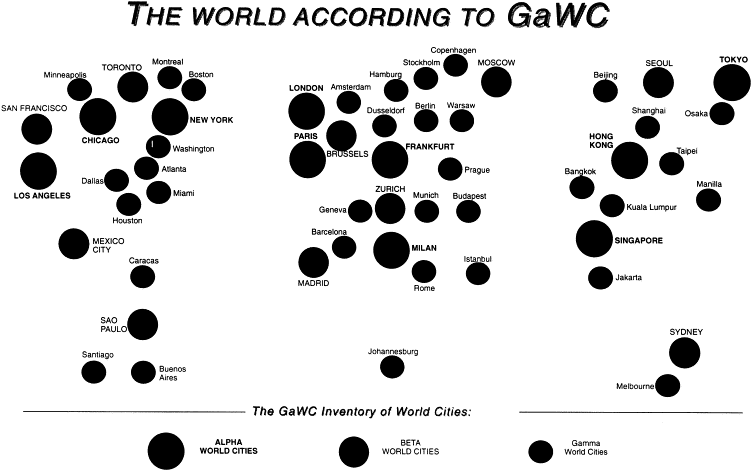
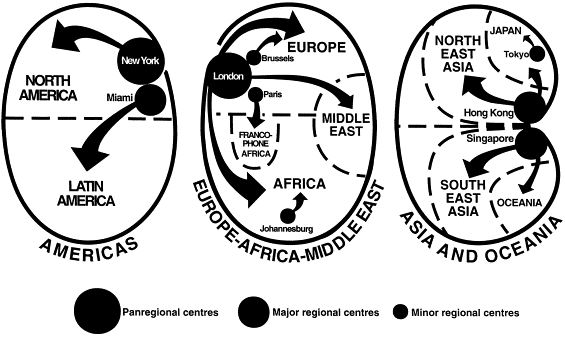
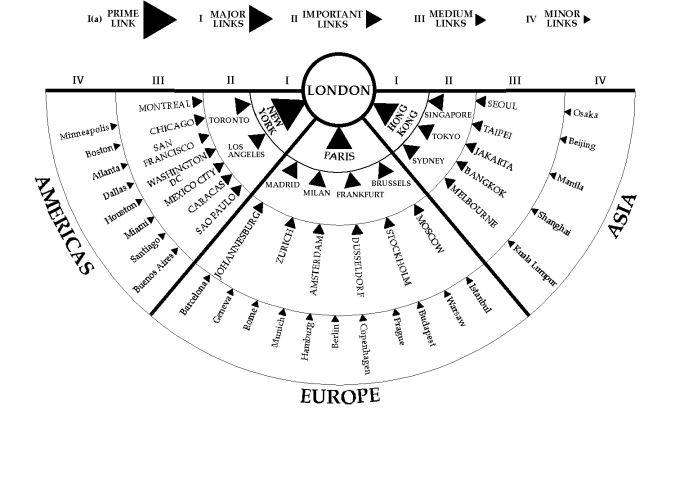
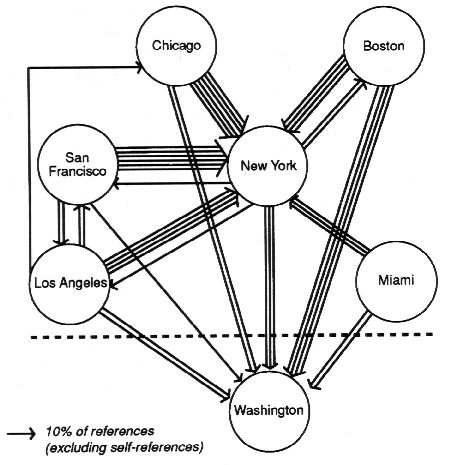
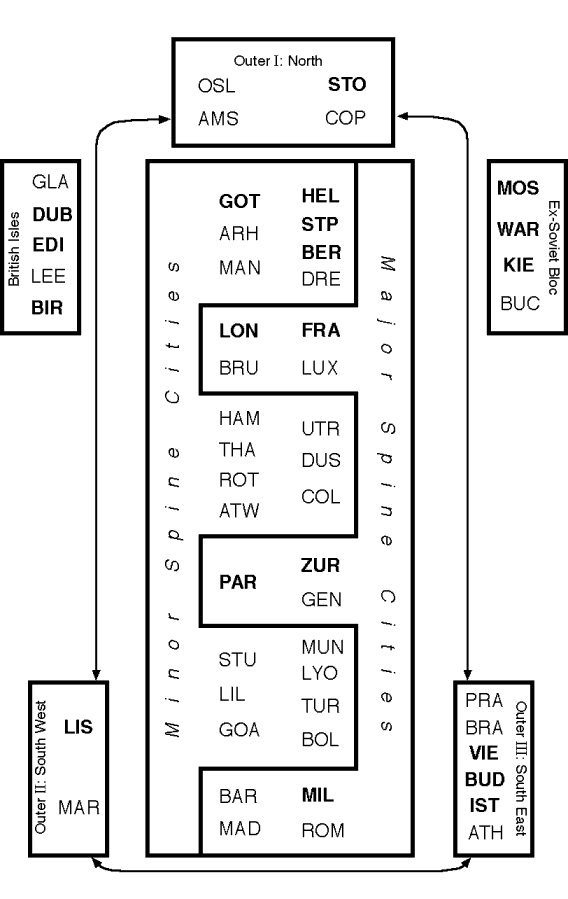
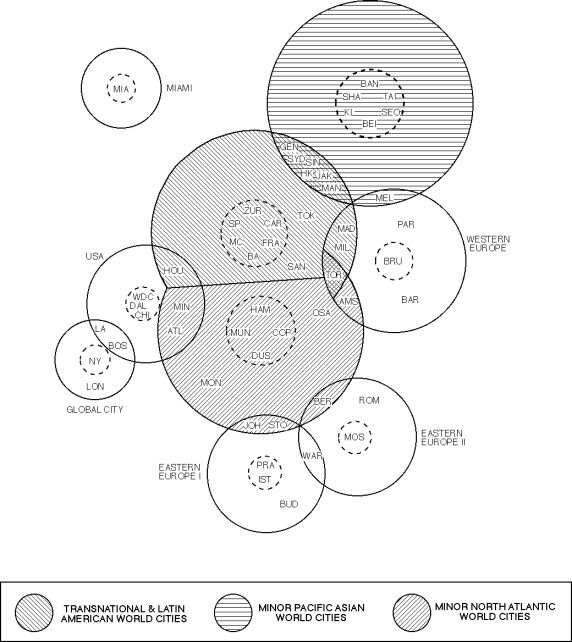
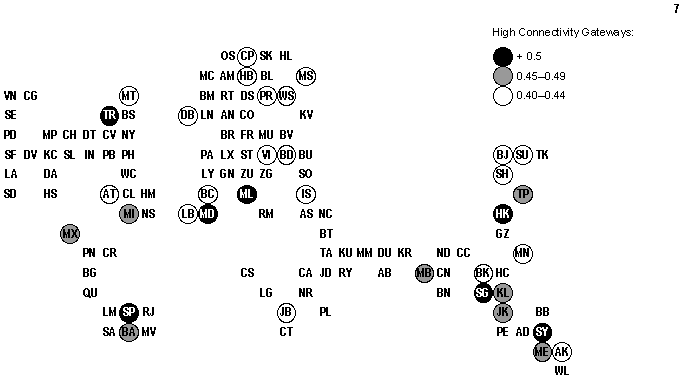
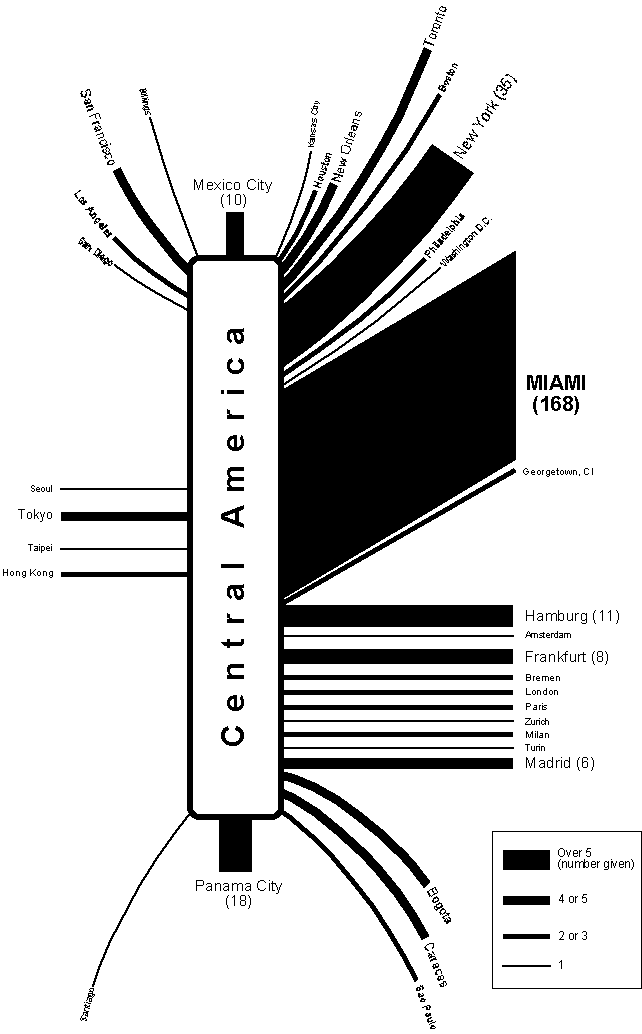
Innovative visualisation of inter-city relations has been part of the GaWC endeavour from the very beginning. The examples below are some of the formative visualisations in early GaWC research.
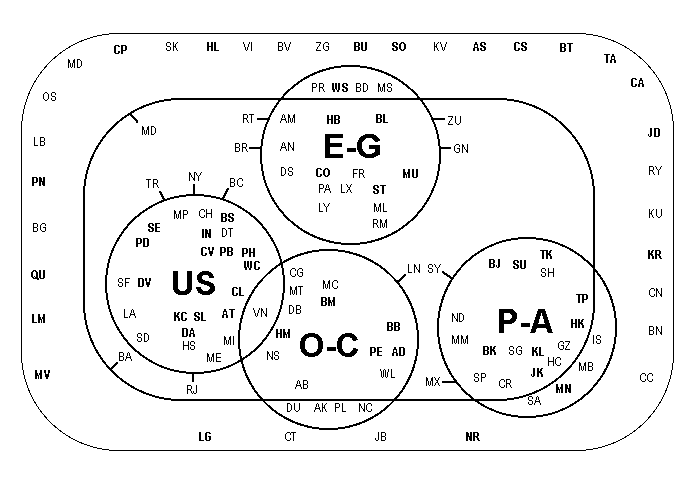
Innovative visualisation of inter-city relations has been part of the GaWC endeavour from the very beginning. The examples below are some of the formative visualisations in early GaWC research.