There is a large literature on the clustering of firms, including service firms. Systematic and comprehensive mapping of clusters within cities was conspicuous by its absence in this literature when this atlas was compiled. In our Atlas of Economic Clusters maps are presented of the spatial clustering of firms in 14 service sectors in one world city, London.
The maps were originally produced for the City of London and Research into Business Clusters project (2001-02) by David R.F. Walker and Peter J. Taylor and some of the results were included in the appendix of the project report. In this atlas zonal maps of sector clusters are included as new items. The methodology is described in summary form below; for more details reference should be made to the report.
References
Report: Taylor, P.J., Beaverstock, J.V., Cook, G., Pandit, N., Pain, K. and Greenwood, H. (2003) Financial Services Clustering and its Significance for London, London: Corporation of London.
See also: Cook, G.A.S., Pandit, N.R., Beaverstock, J.V., Taylor, P.J. and Pain, K. (2007) The role of location in knowledge creation and diffusion: evidence of centripetal and centrifugal forces in the City of London financial services agglomeration, Environment and Planning A, 39 (6), 1325-1345.
Data
Data on companies were supplied by market locations from Companies House registers. Each company record included a SIC coding and an address.
The data from which the maps were derived were selected on the basis of 14 composite groups (sectors) as shown below. In this way the locations of 17836 offices across central London were identified.
The 14 sectors are (the numbers in brackets are the SIC codes):
Banks: Banks (65121), Building Societies (65122), Financial leasing (6521), Other credit (6522), Credit granting (65229), Factoring (65222), Mortgage finance (65223), Other credit granting (65229), Investment trusts (65321), Units trusts (65232), Security dealing (65233), Venture capital (65235).
Insurance: Life insurance (6601), Pension funding (6602), Non-life insurance (6603).
Auxiliary Finance: Administration of financial markets (6711), Fund management (67121), Security broking (67122), Auxiliary/intermediation (6713), Auxiliary/insurance and pension funding (6720).
Real Estate: Development (7011), Letting conference centres (70201), Other letting (70209), Agencies (7031).
IT: Hardware consultancy (7210), Software consultancy (7220), Data processing (7230), Data bases (7240), Maintenance (7250).
Law: Legal (74119).
Accountancy: Accounting/auditing (74121), Tax consultancy (74123).
Management Consultancy: Business consultancy (7414), Public relations (74141), Financial management (74142), General management consultancy (74143), Other management consultancy (74149).
Architecture/Engineering: Technical (7420), Architecture (74201), Urban planning (74202), Quantity surveying (74203), Engineering design consultancy (74204), Engineering industrial design (74205), Engineering technical consultancy (74206), Testing and analysis (7430).
Advertising: Advertising (7440), Advertising space/time (74401), Creation and placement (74402), Other advertising (74409).
Recruitment: Labour recruitment (7450)
Business Support: Cleaning (74701), Photographic (74819), Secretarial and translations (7483), Speciality design (74842), Exhibition organisers (74843), Conference organisers (74844), Other business (74849).
Charities: Charitable social work (85321).
Organisations: Business and employer organisations (9111), Professional organisations (9112), Trade unions (9120), Religious organisations (9131), Other (9133).
Maps
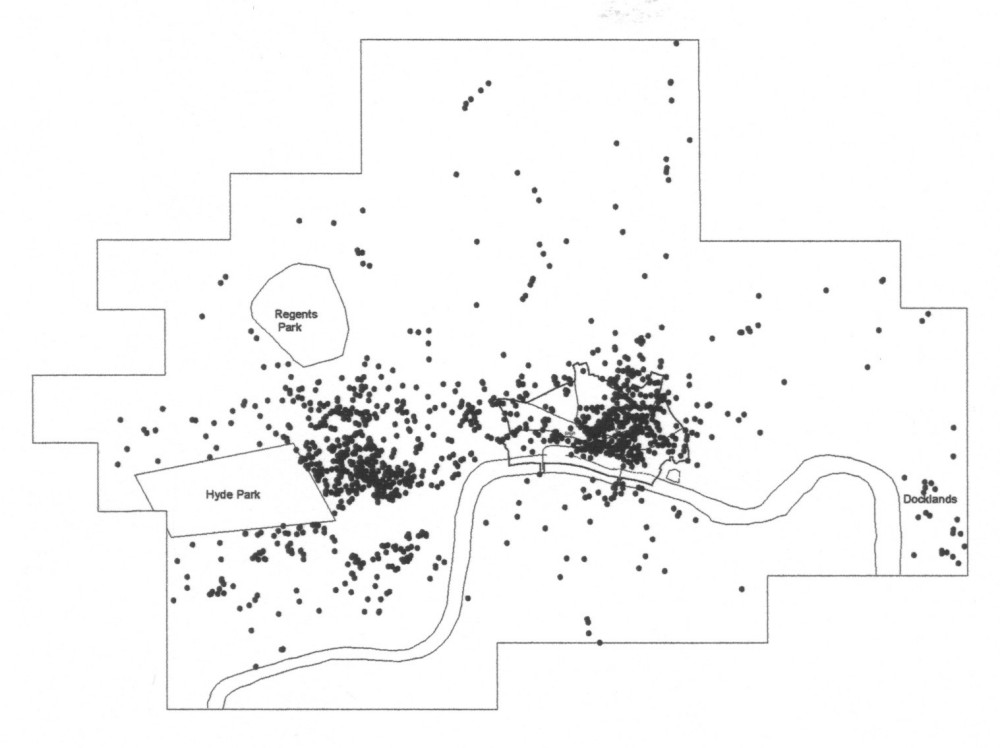
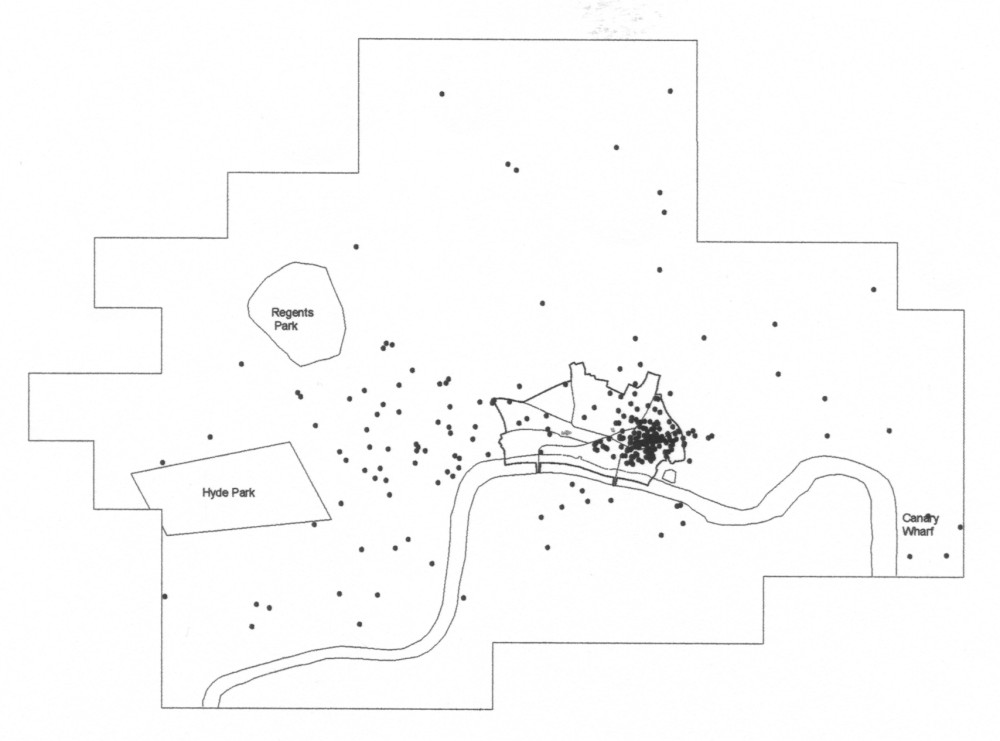
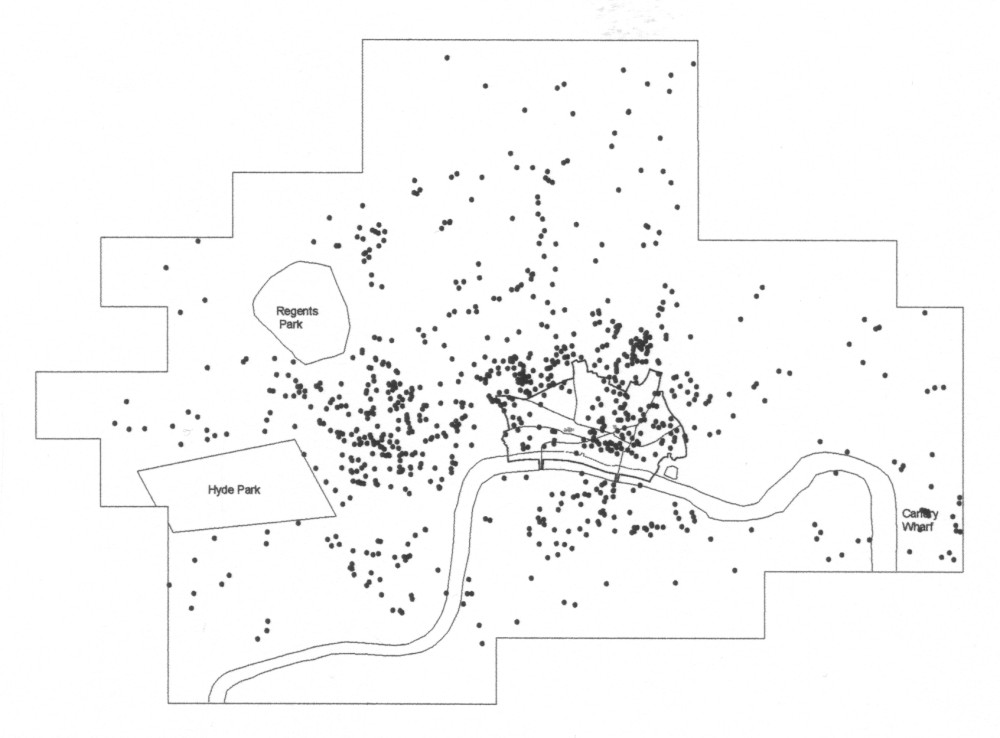
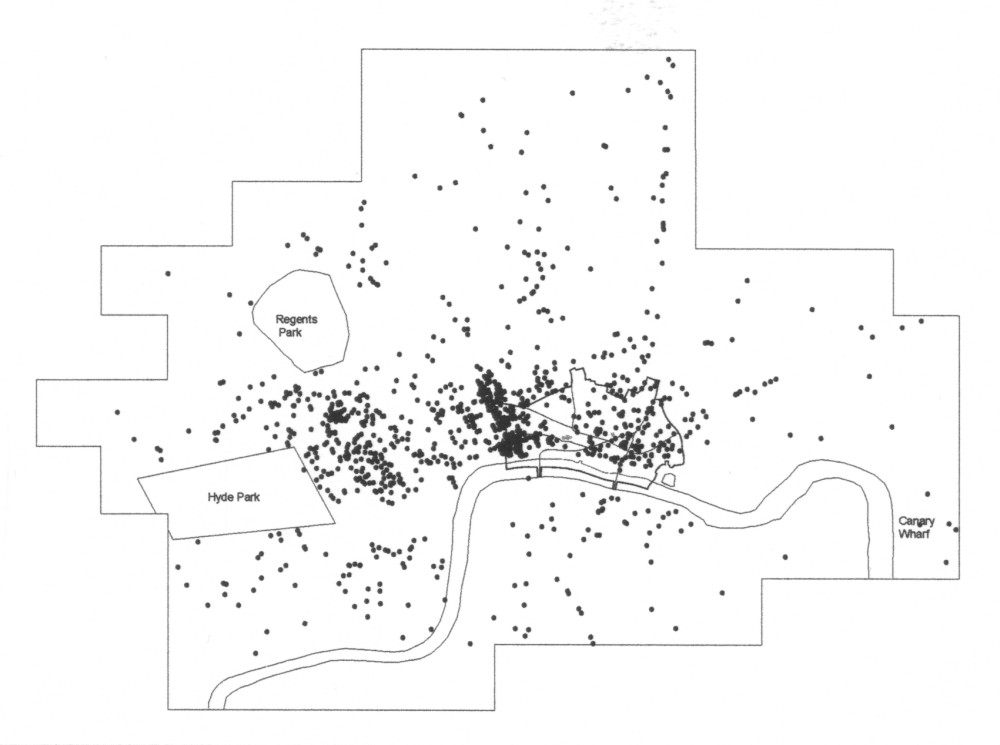
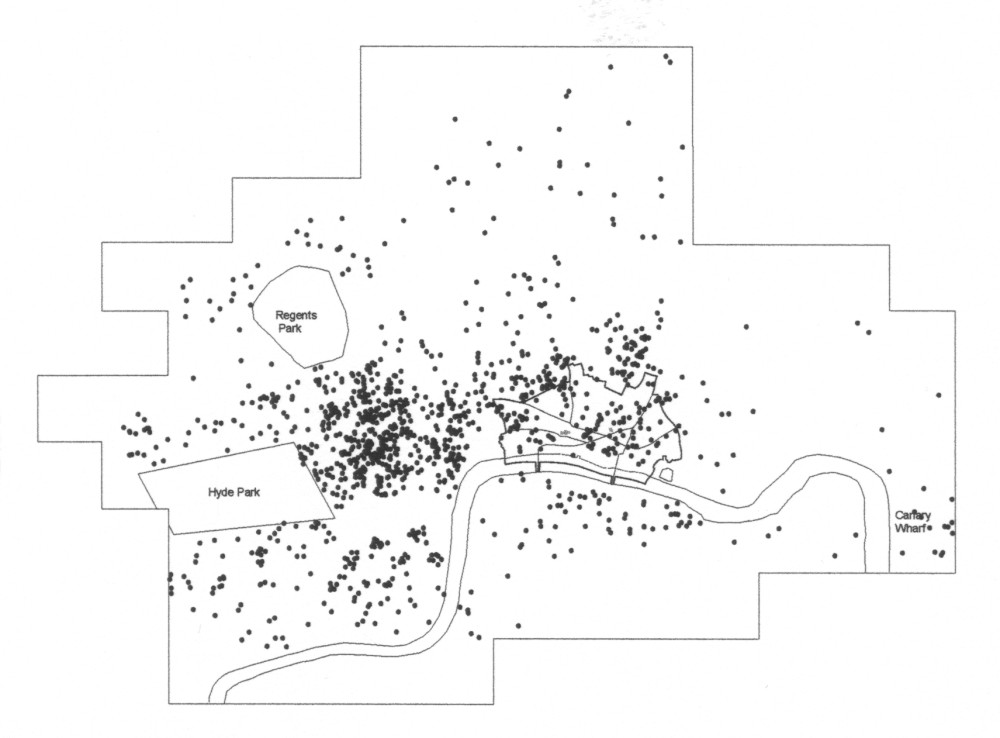
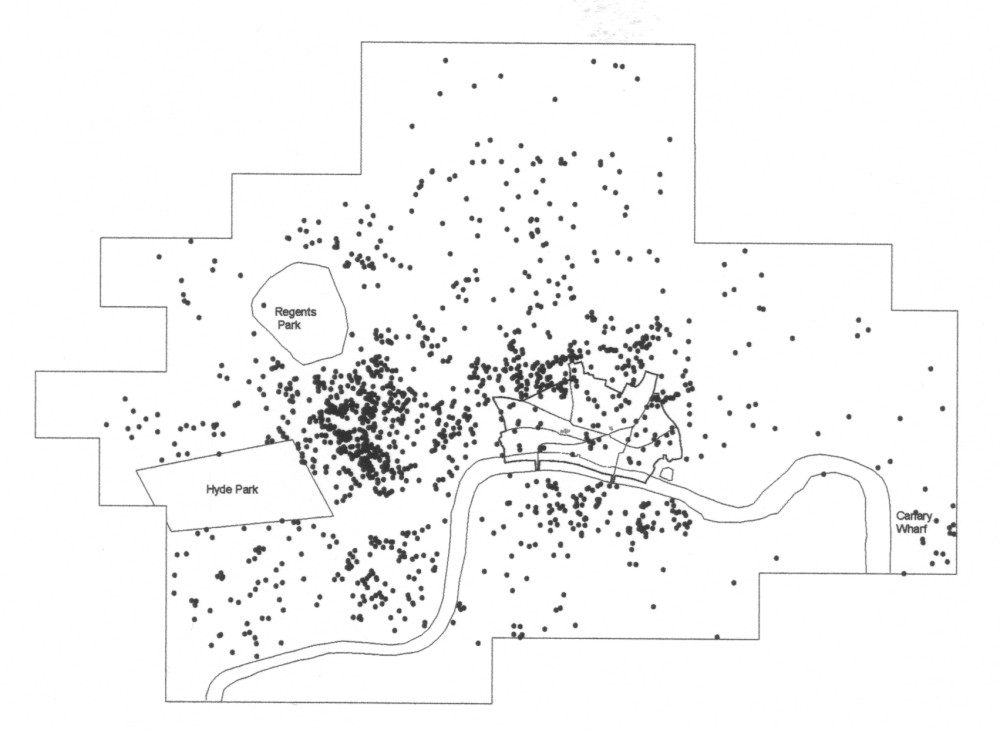
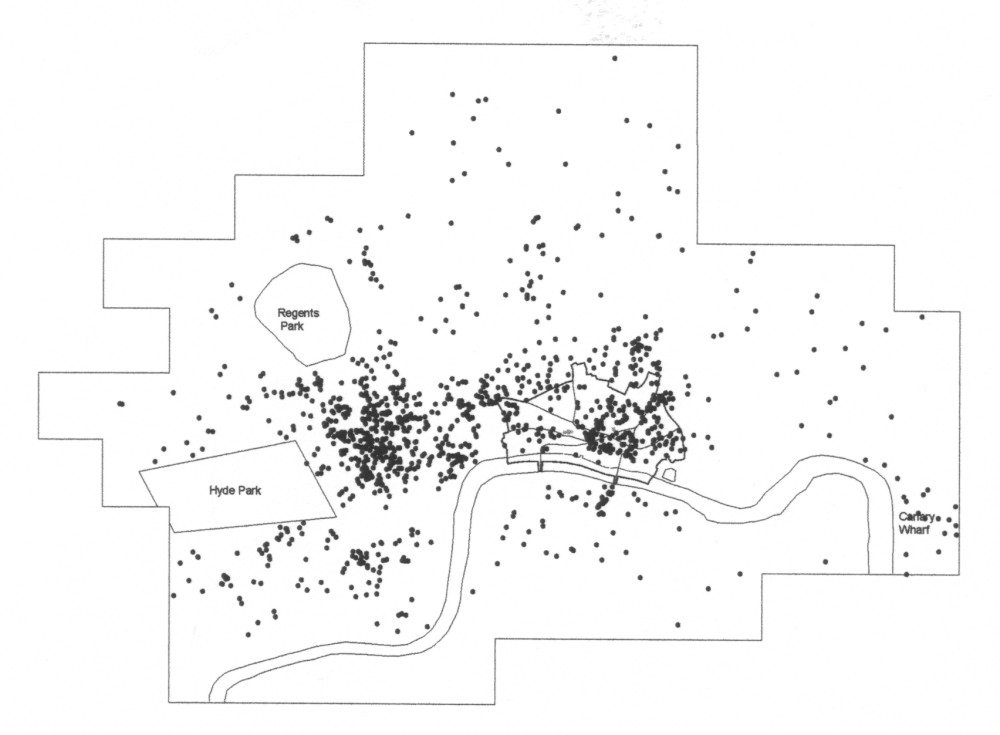
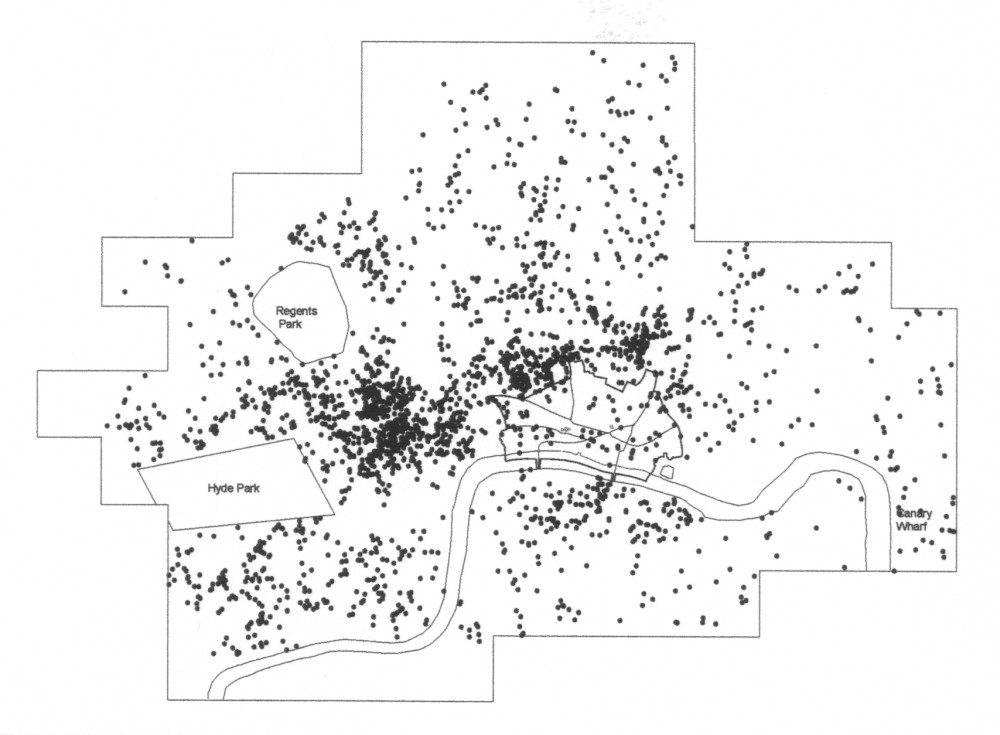
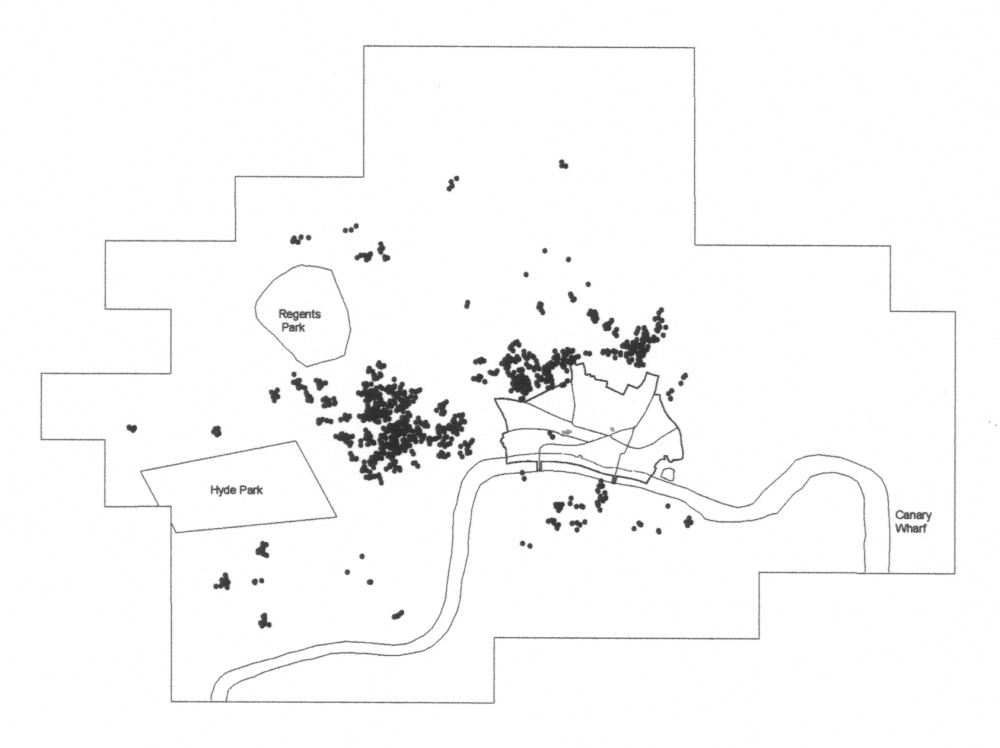
There are three maps drawn for each sector:
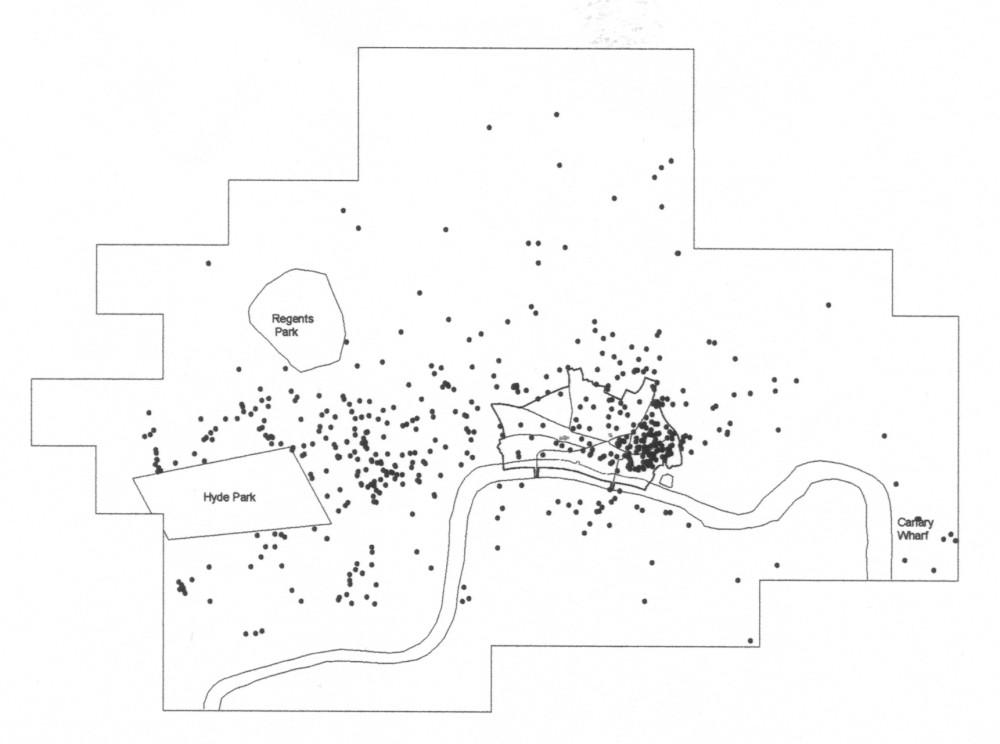
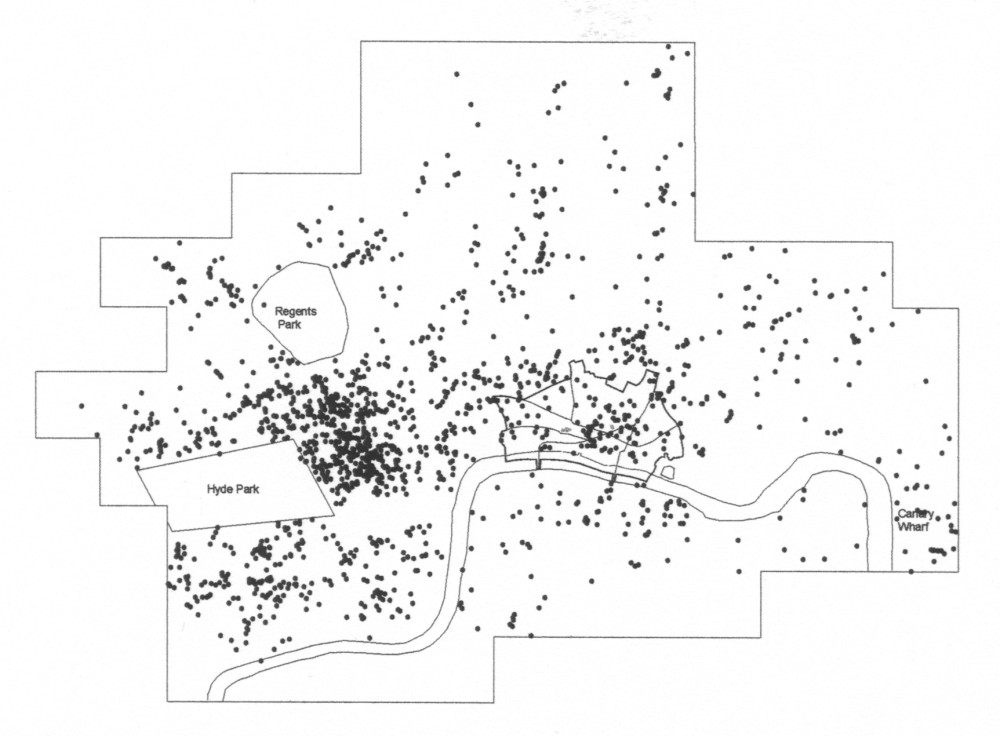
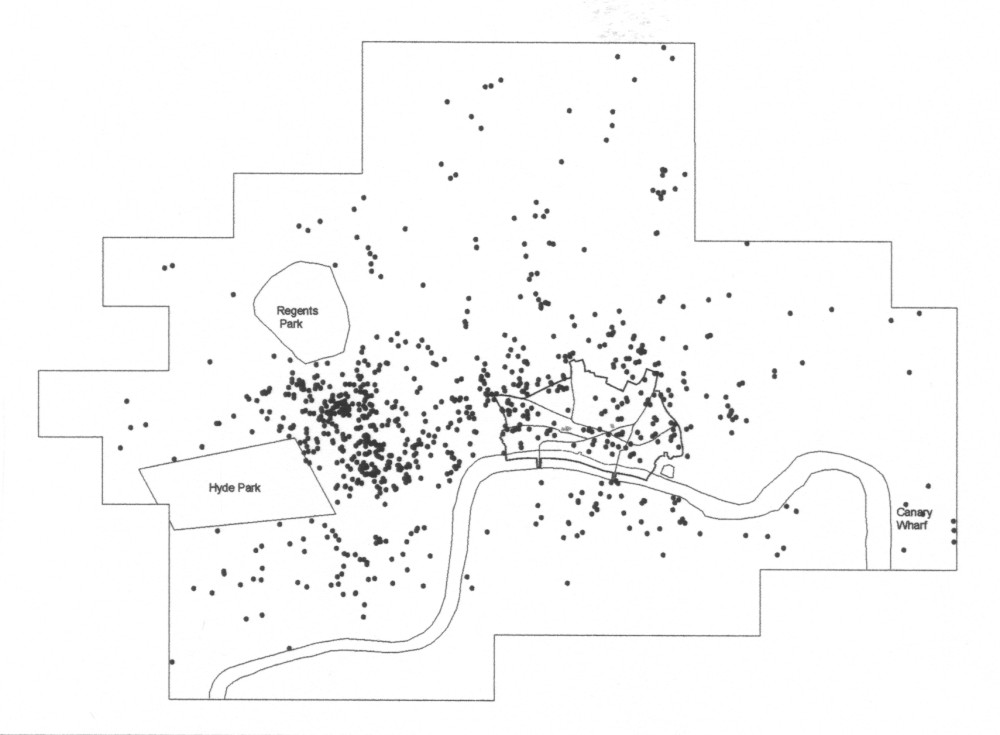
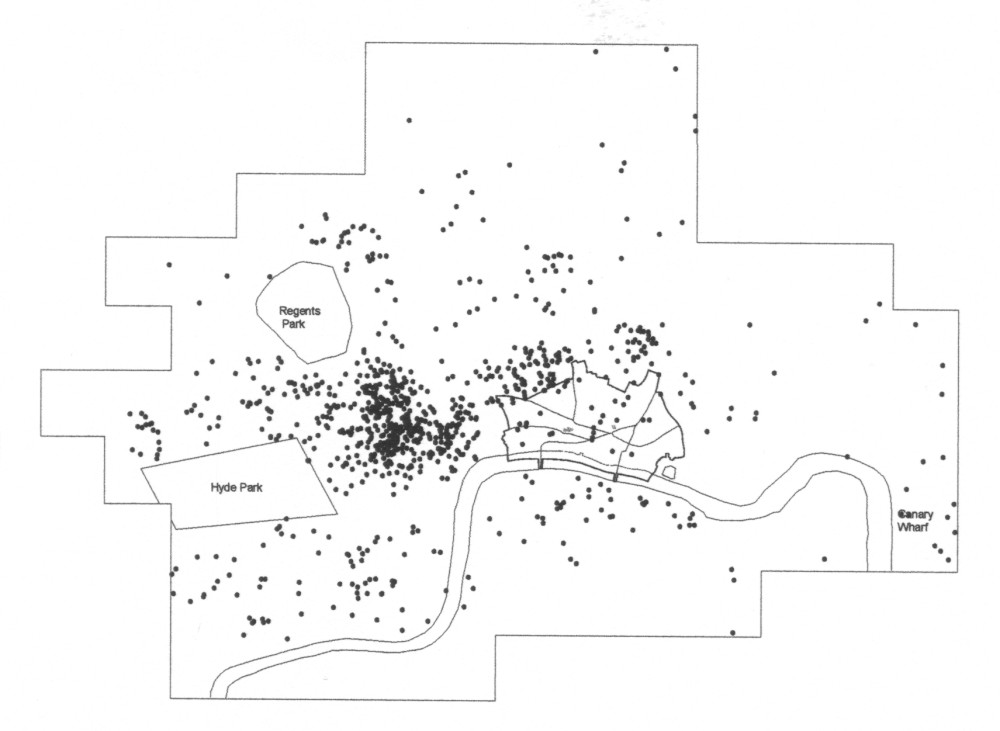
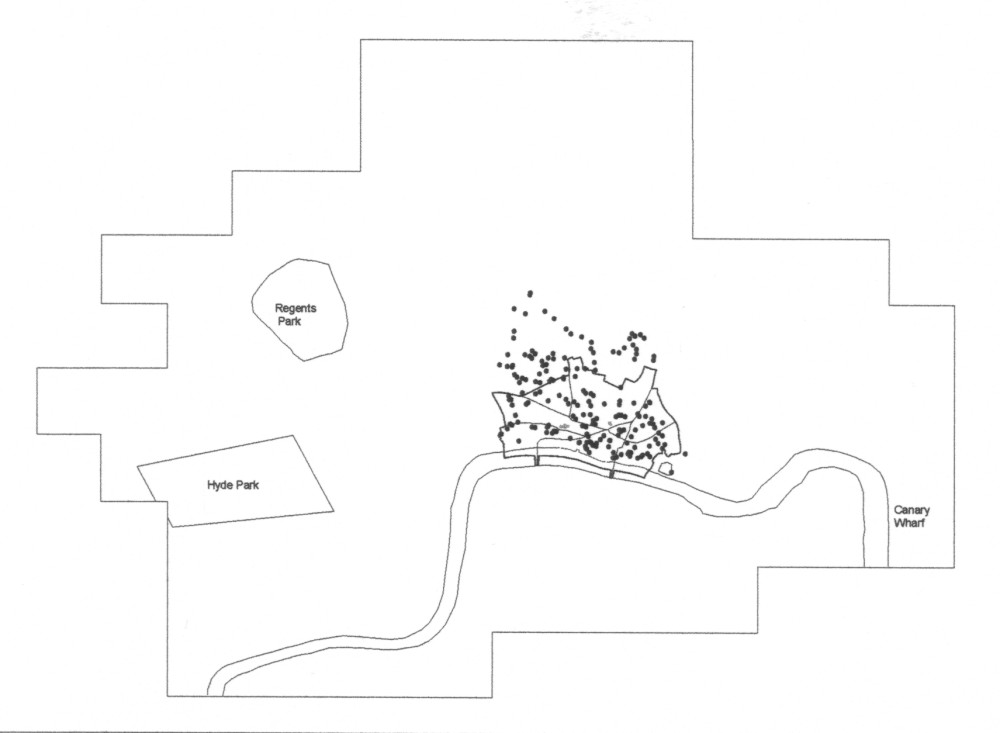
The first map for each sector shows the spatial distribution of firms for that sector. That is to say, the 17836 firms that were located are mapped across 14 maps, one for each sector.
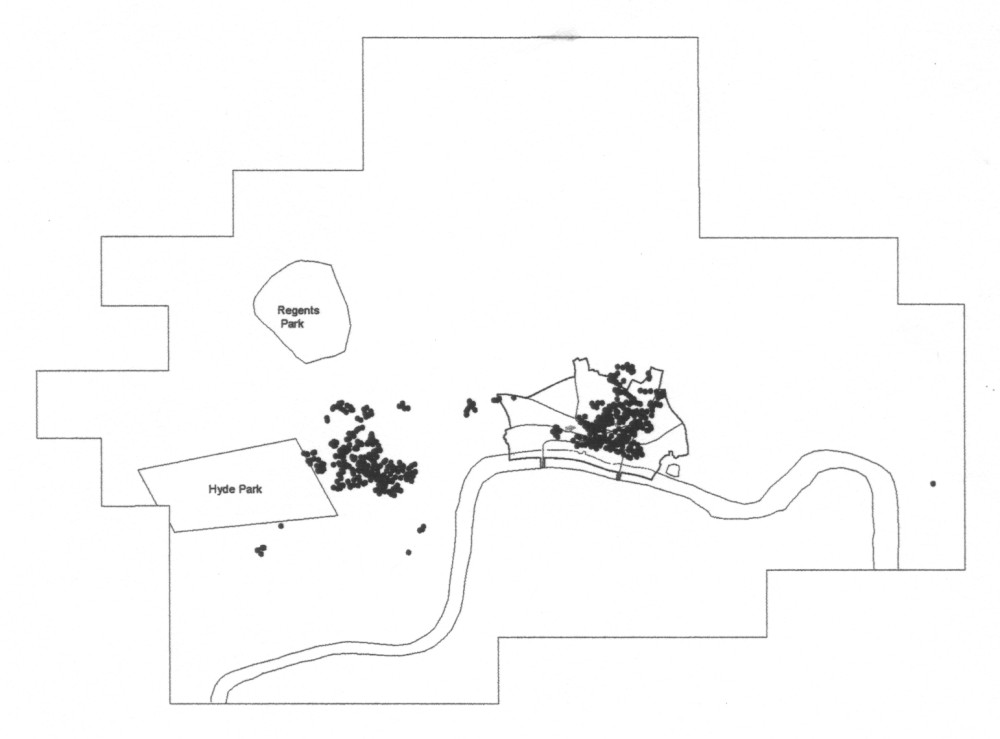
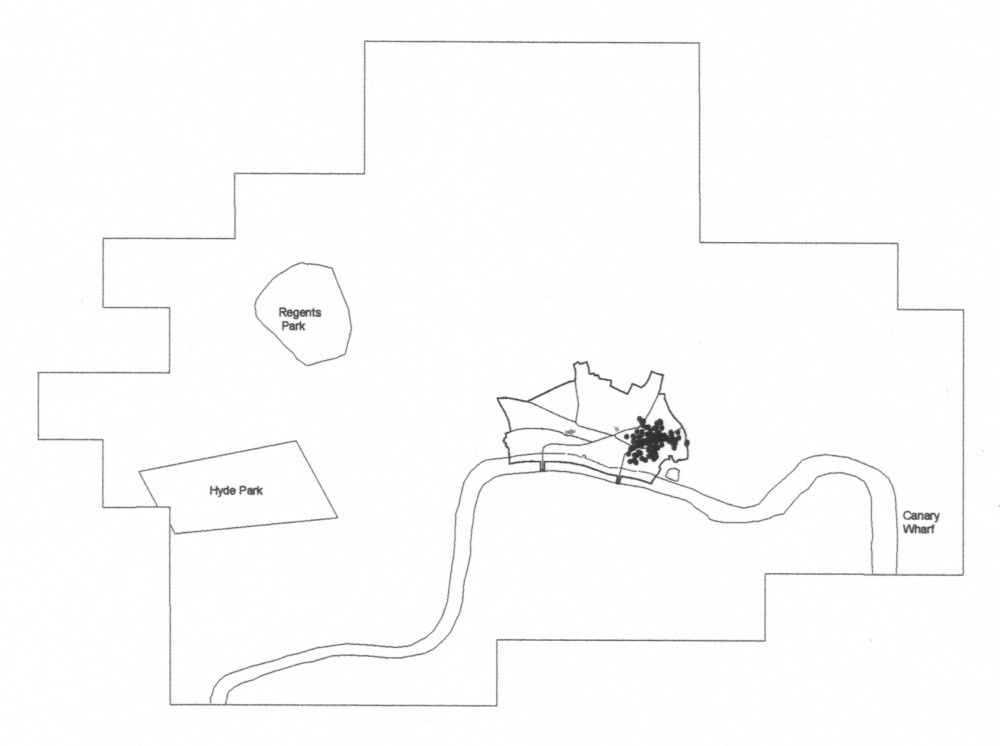
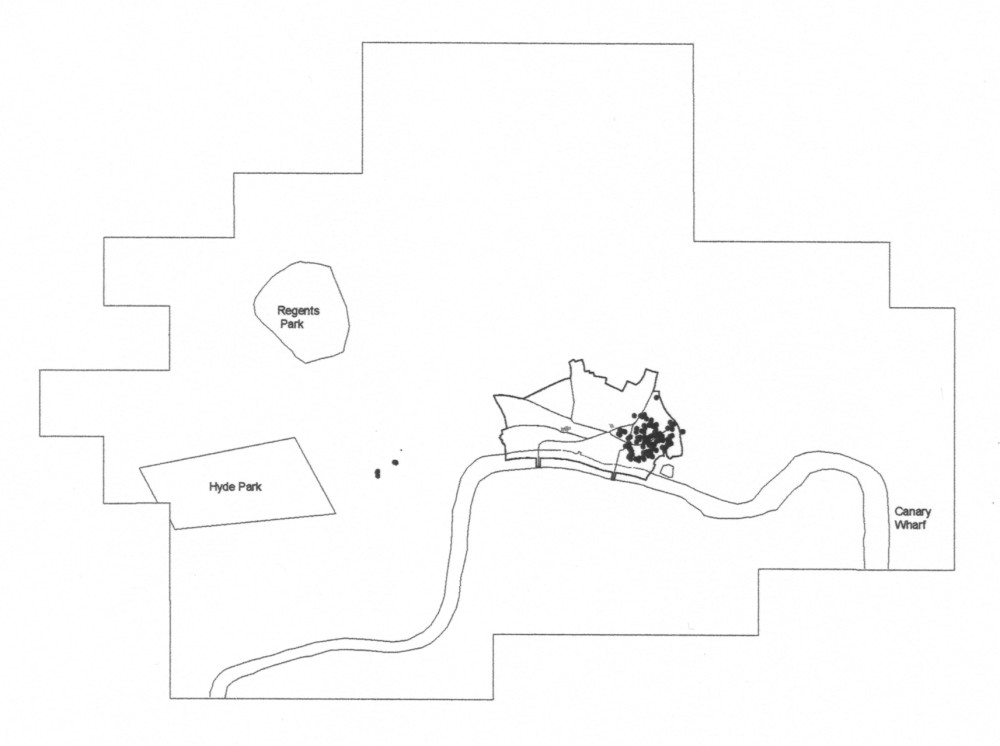
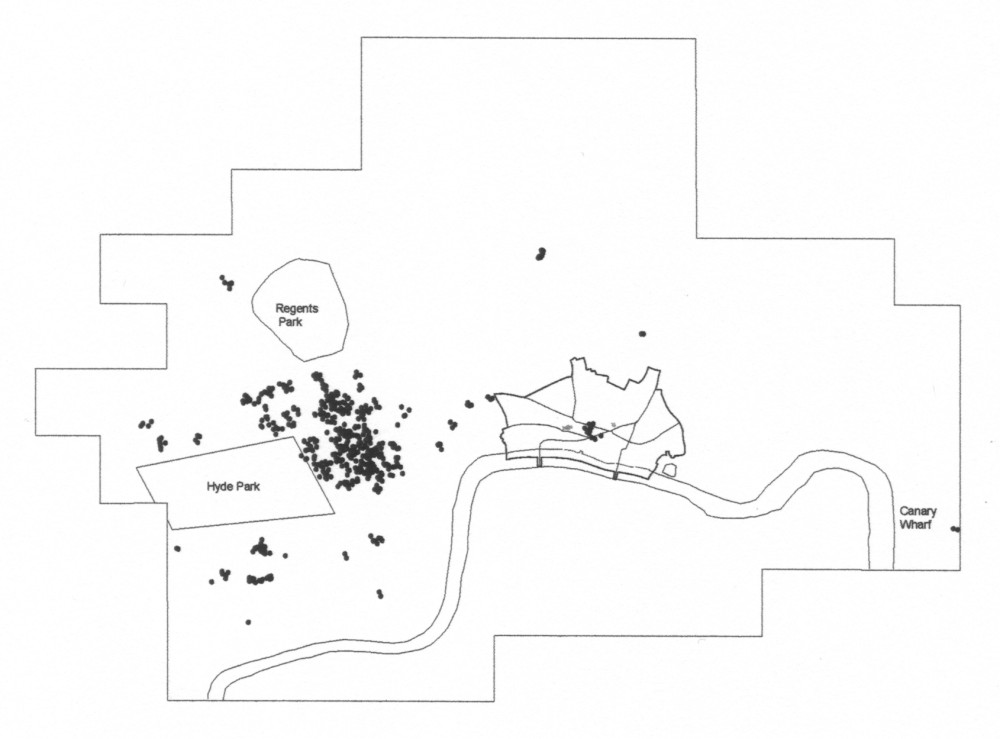
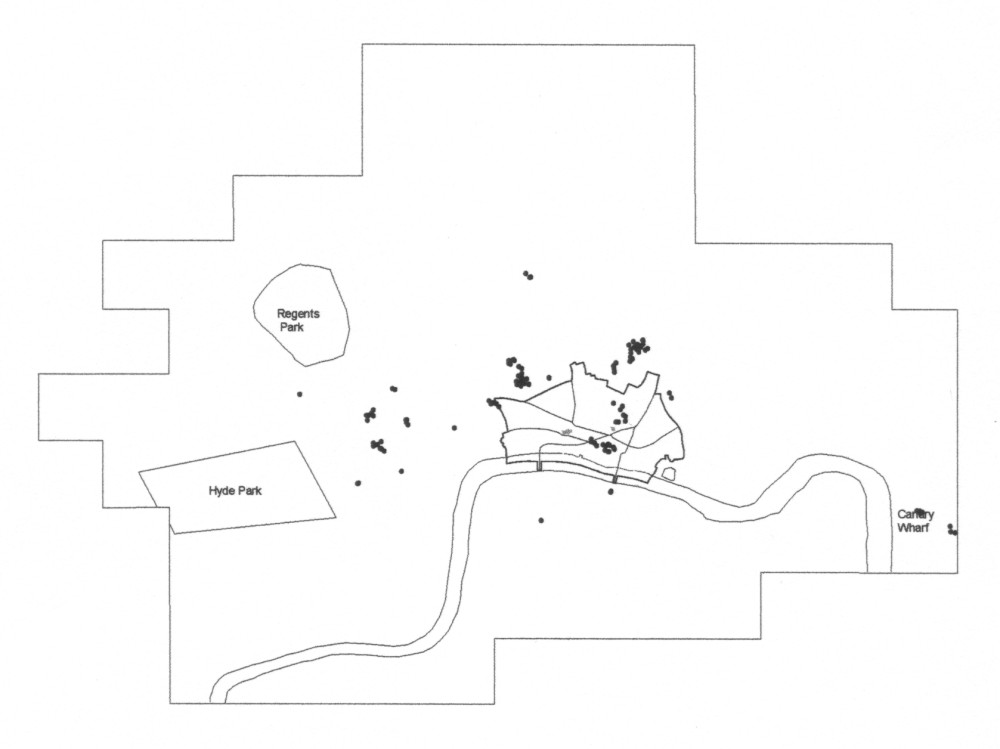
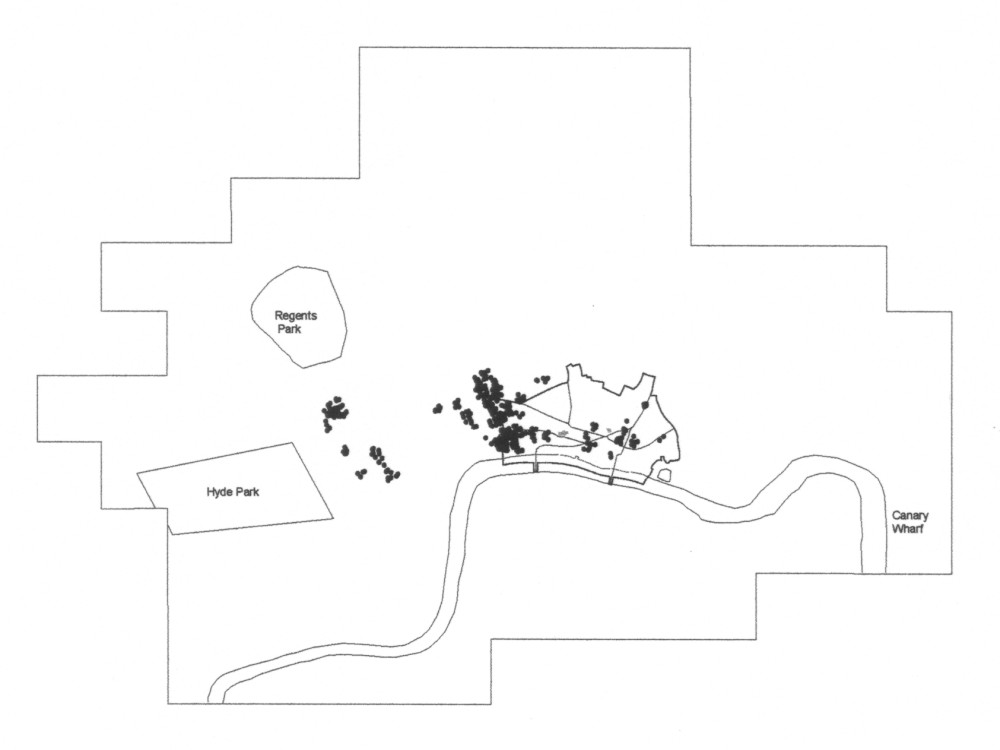
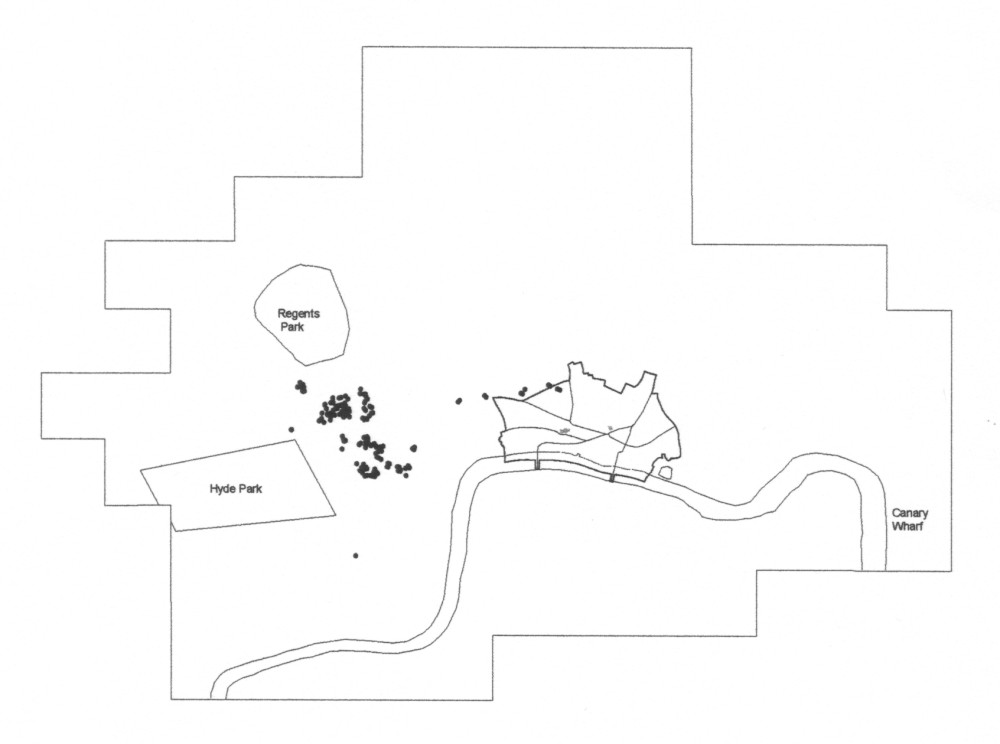
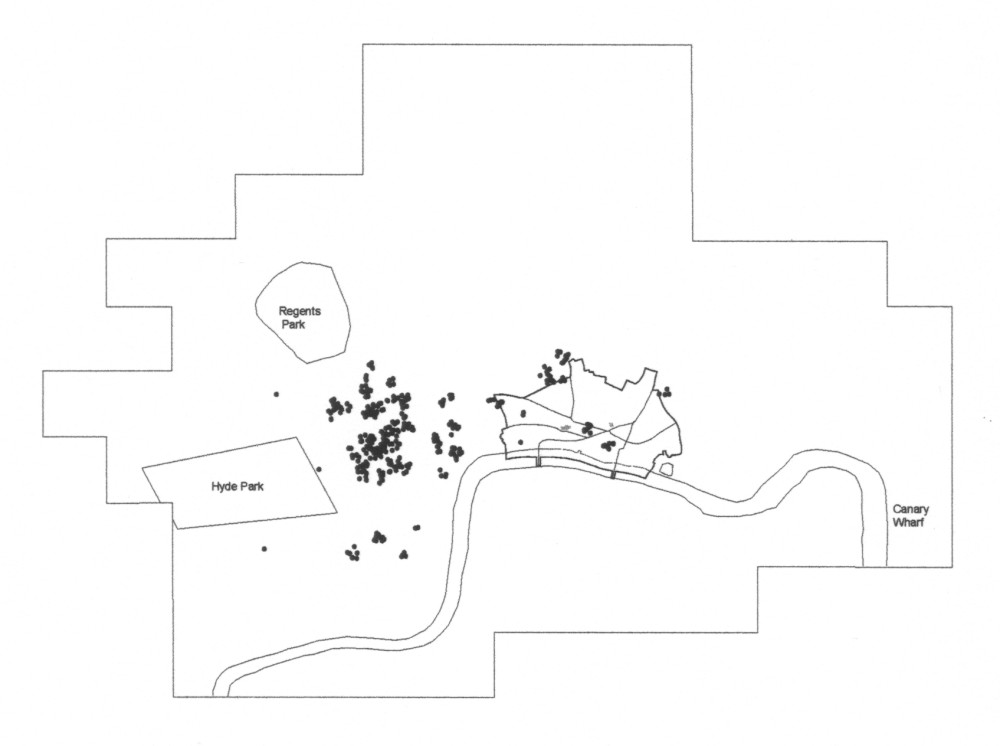
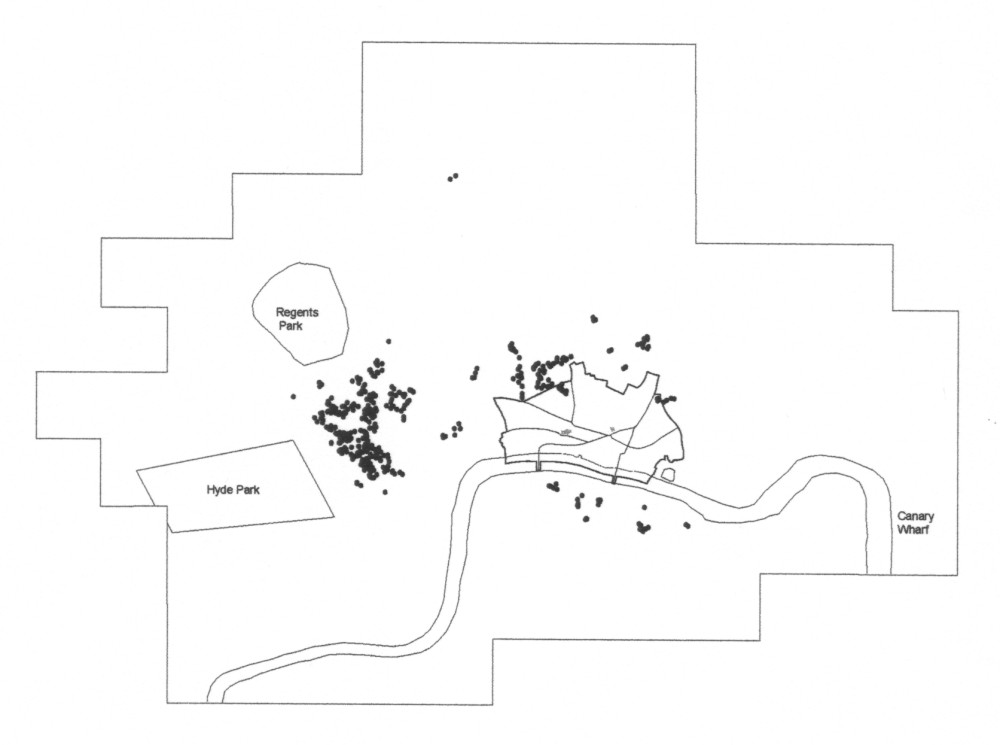
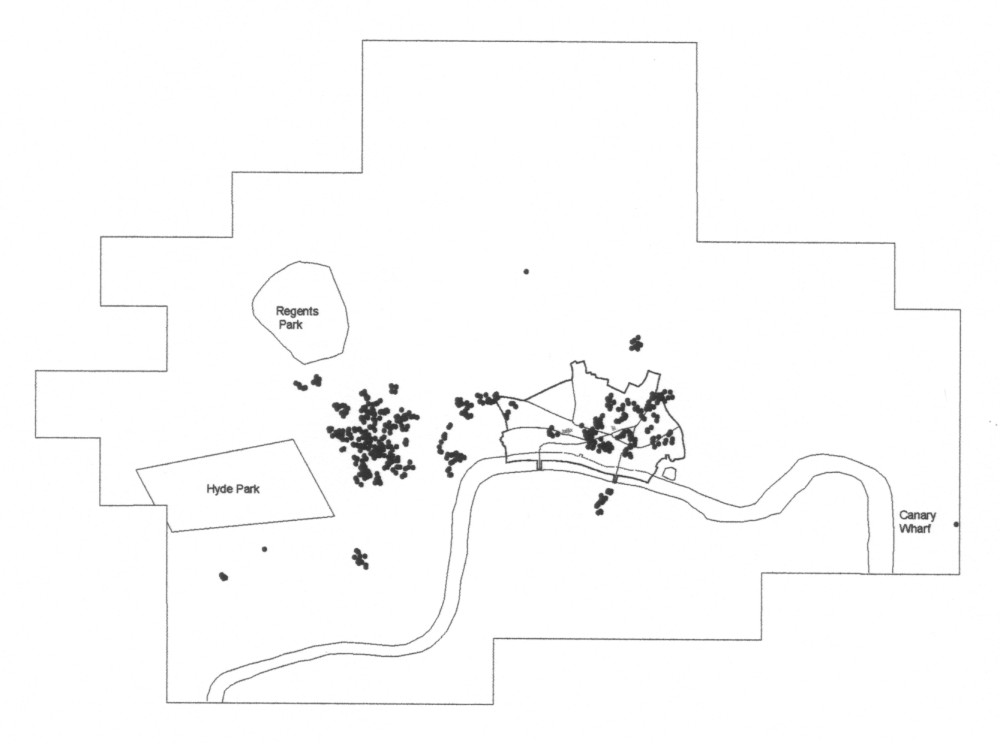
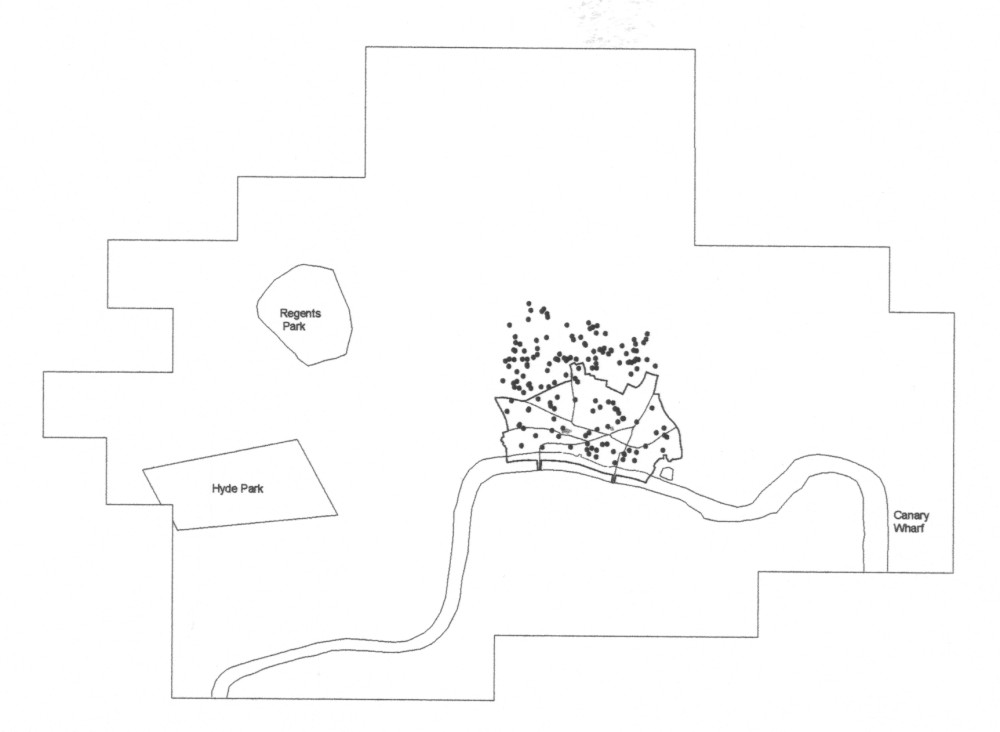
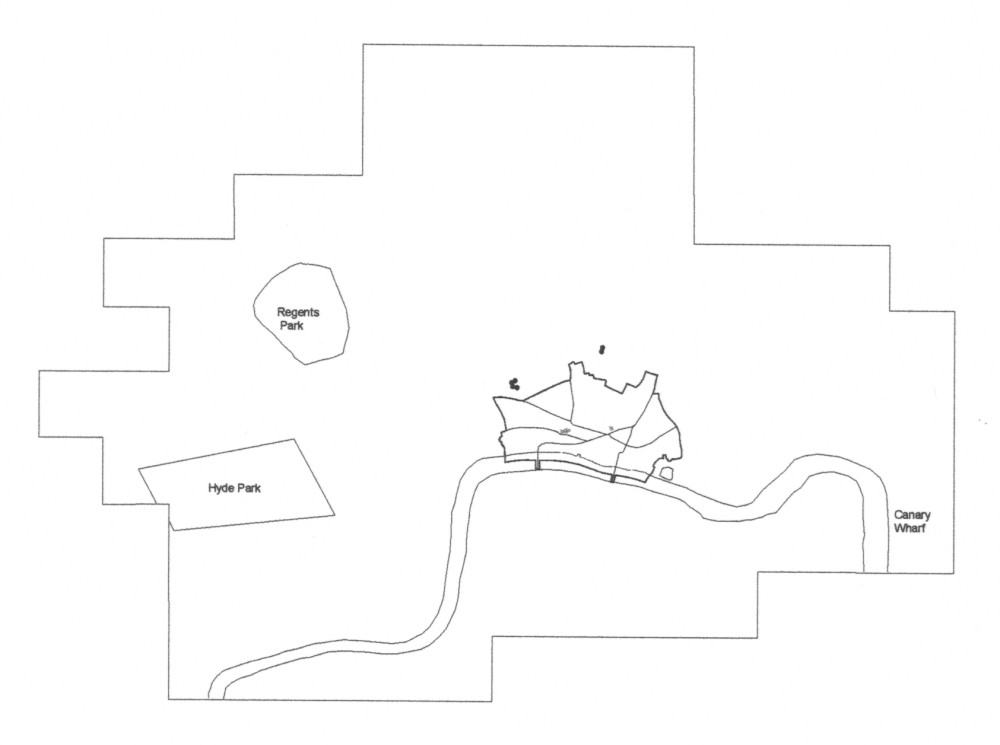
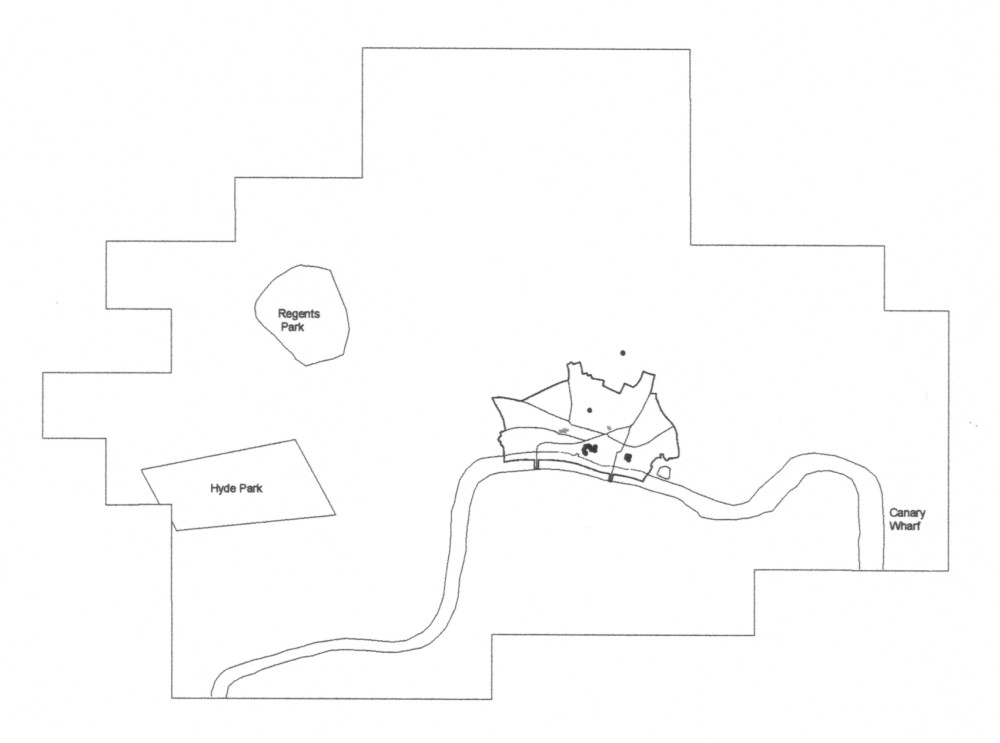
The second map for each sector shows the spatial distribution of ‘clustered firms’. These were produced as follows:
A clustered firm is defined as one whose average distance to its 10 nearest neighbours (in its sector) is less than 100 metres. Mapping the clustered firms shows where the clustering in a sector is taking place. Basically this map removes all non-clustered firms from the first map to eliminate offices that are widely dispersed across London (e.g. in the case of the banking sector, the local retail banks are removed). These maps also indicate the varying degree of clustering between sectors. This is also indicated by the proportion of offices in a sector that are clustered. This is found to be closely related to the total number of offices in a sector: a cluster index for each sector is computed as a residual from regressing proportion of clustered offices against total number of offices. This index measures how much a sector is over- or under-clustered: figures are given with the maps. For instance, Insurance, Banks and Recruitment show a strong propensity to be in clusters, while Charities, Information Technology and Business Support are characteristically more dispersed.
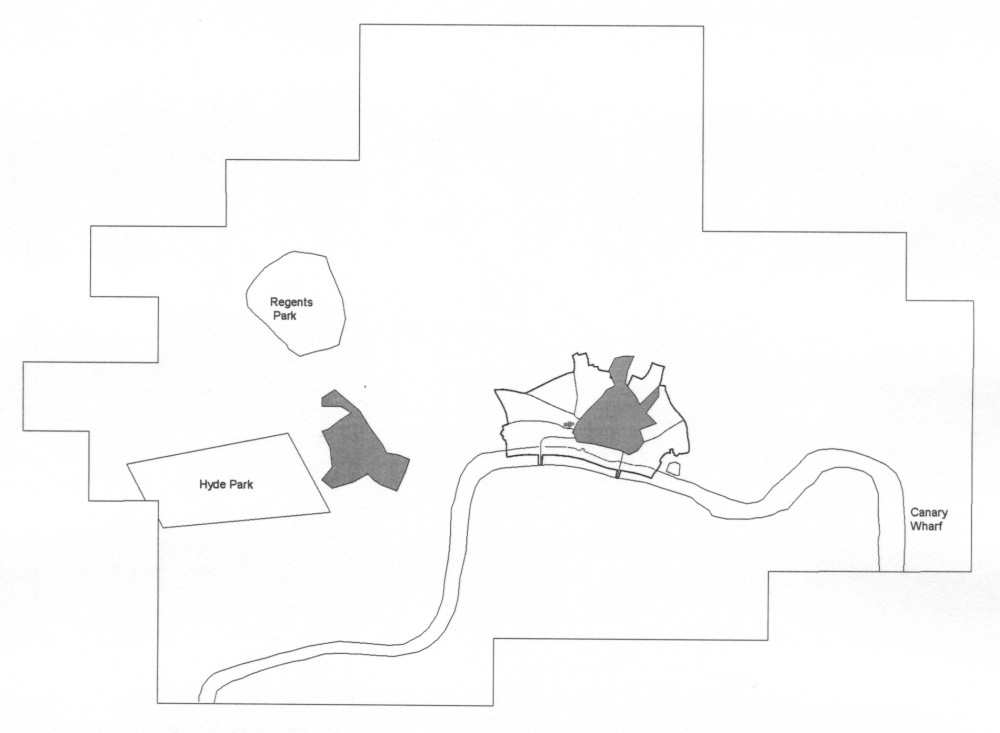
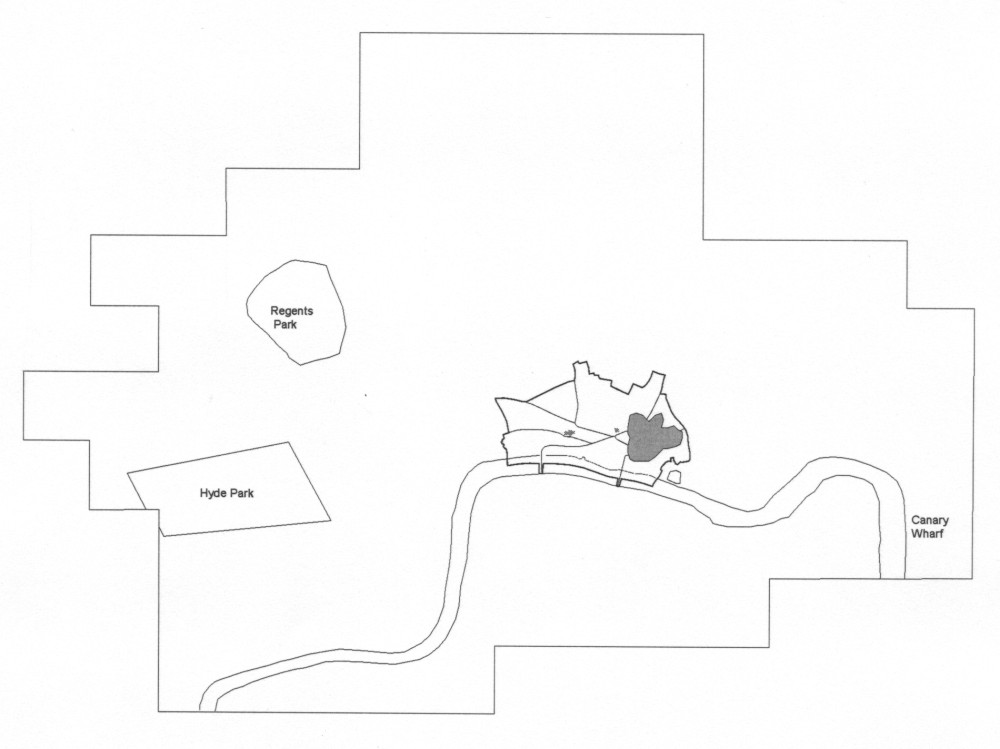
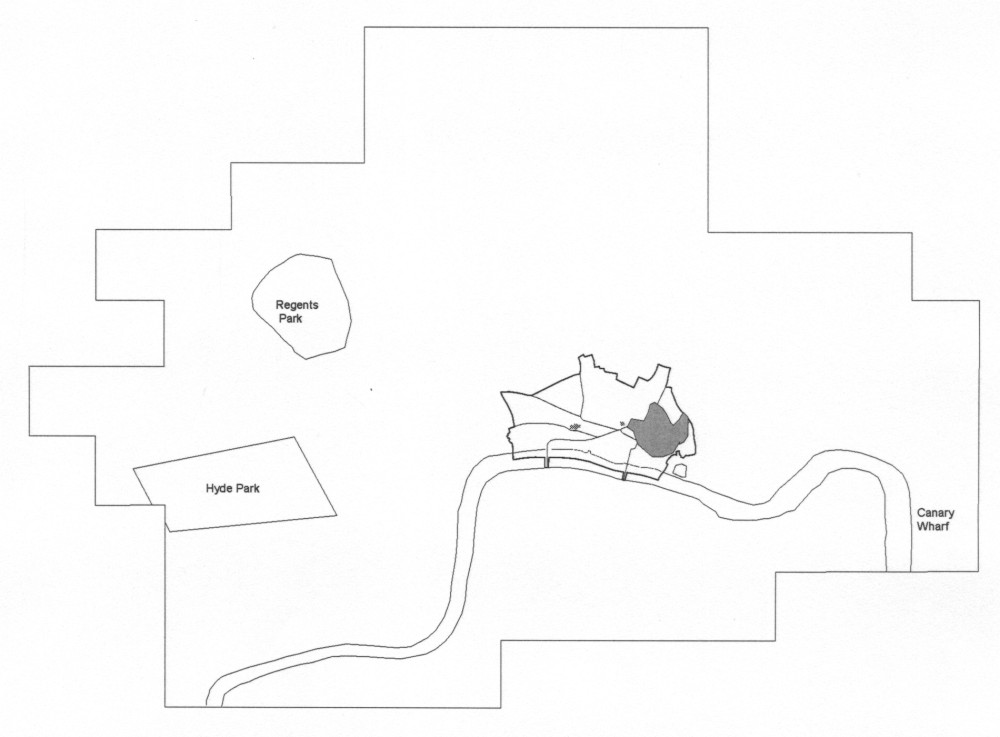
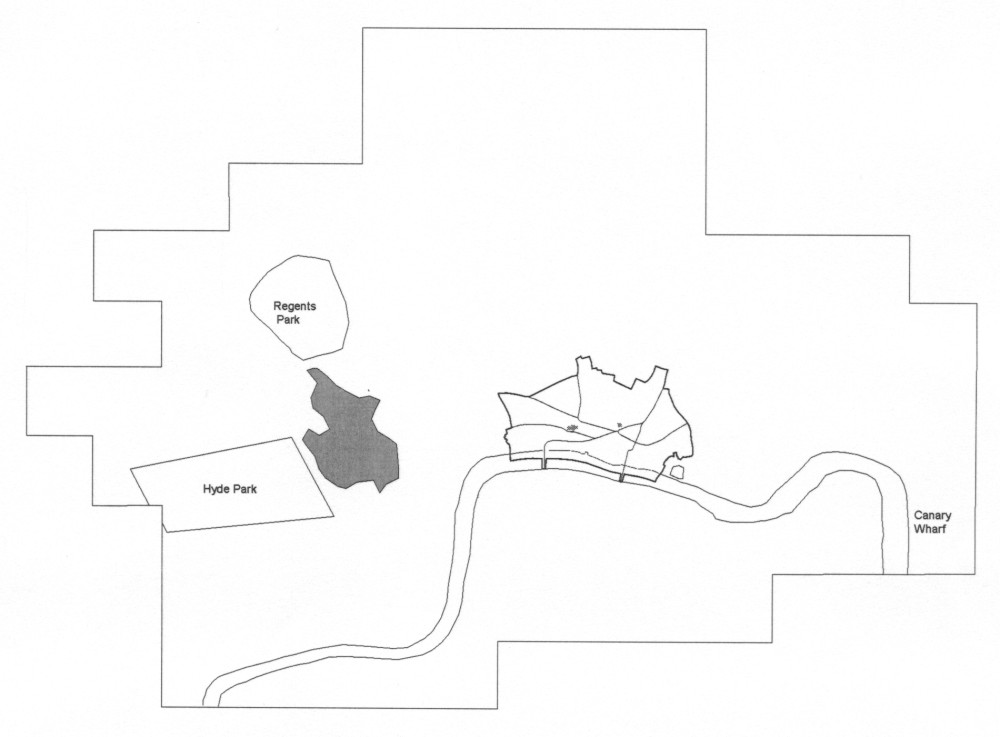
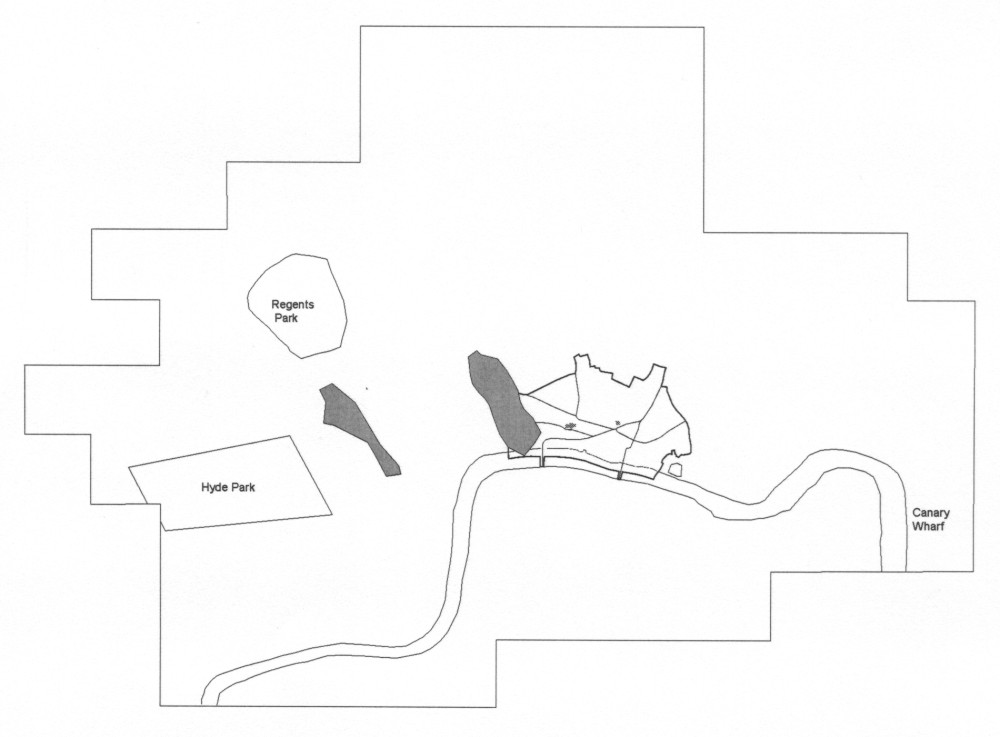
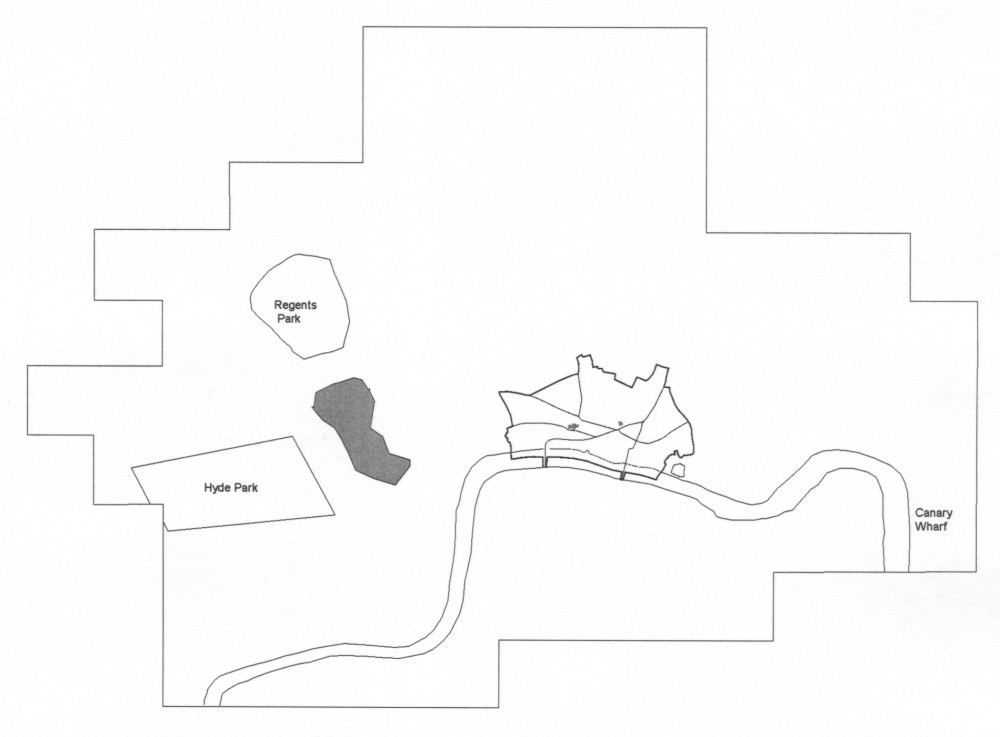
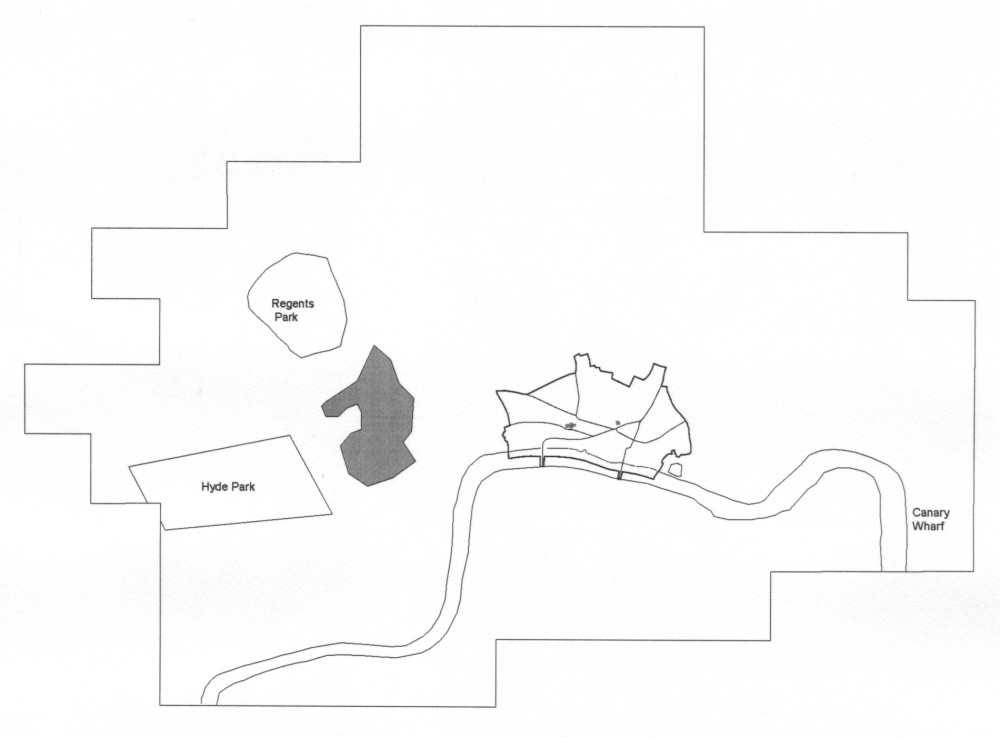
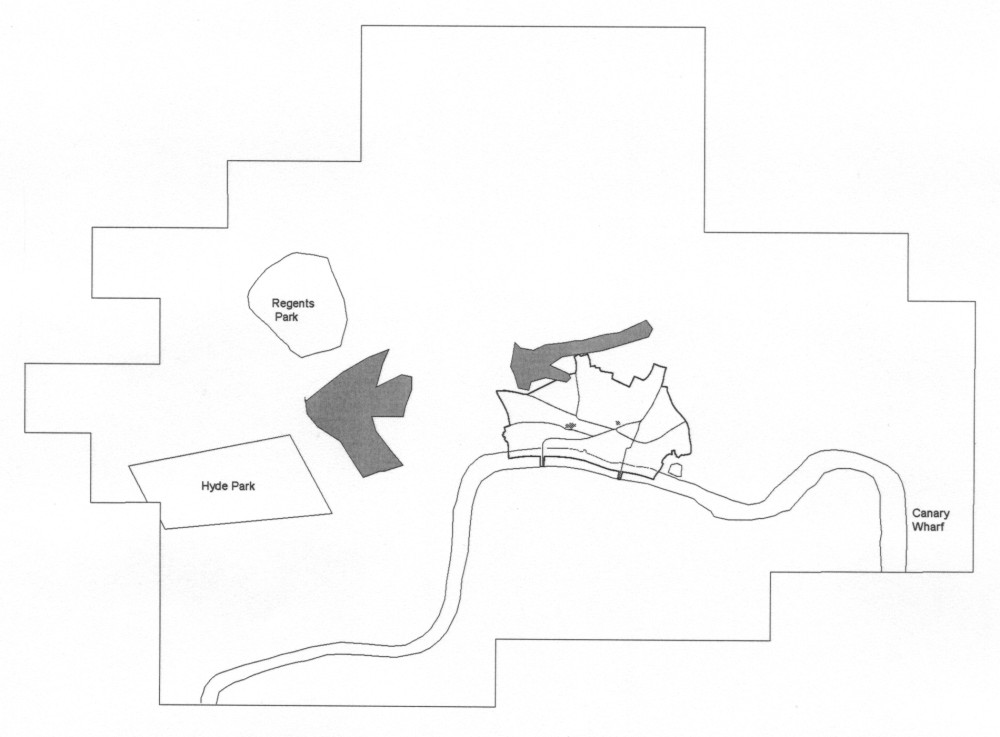
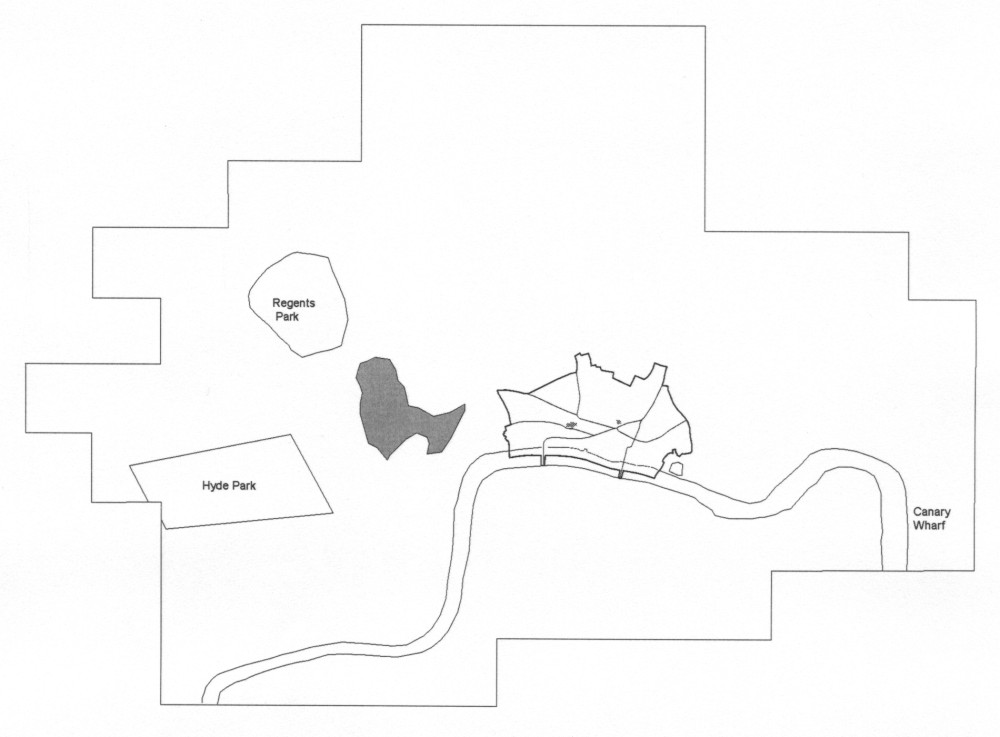
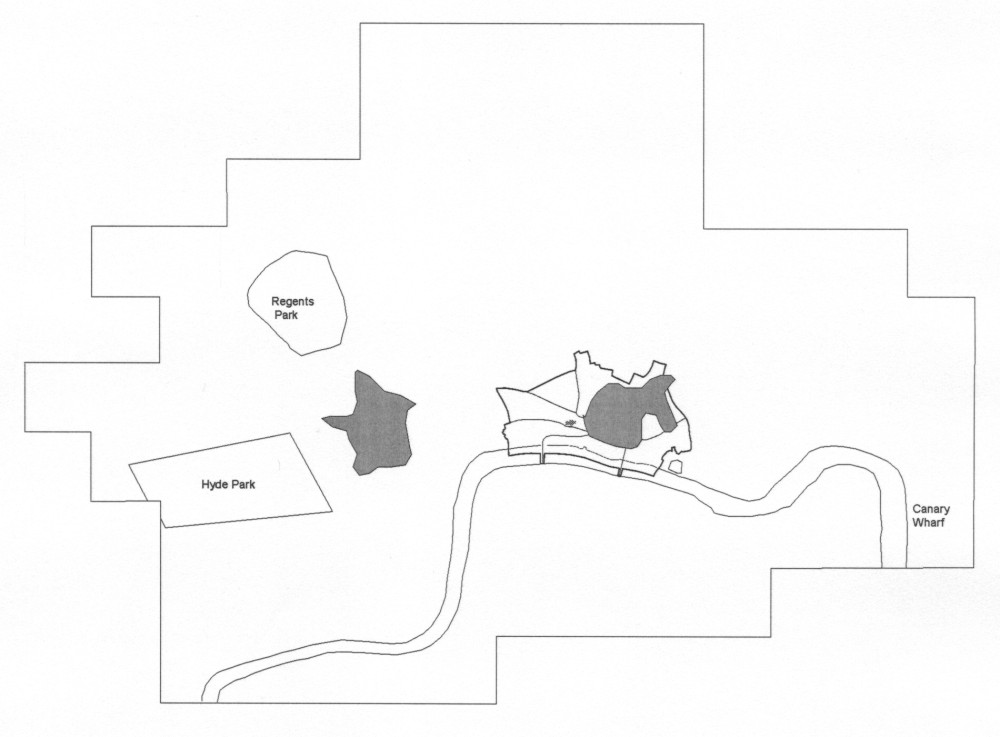
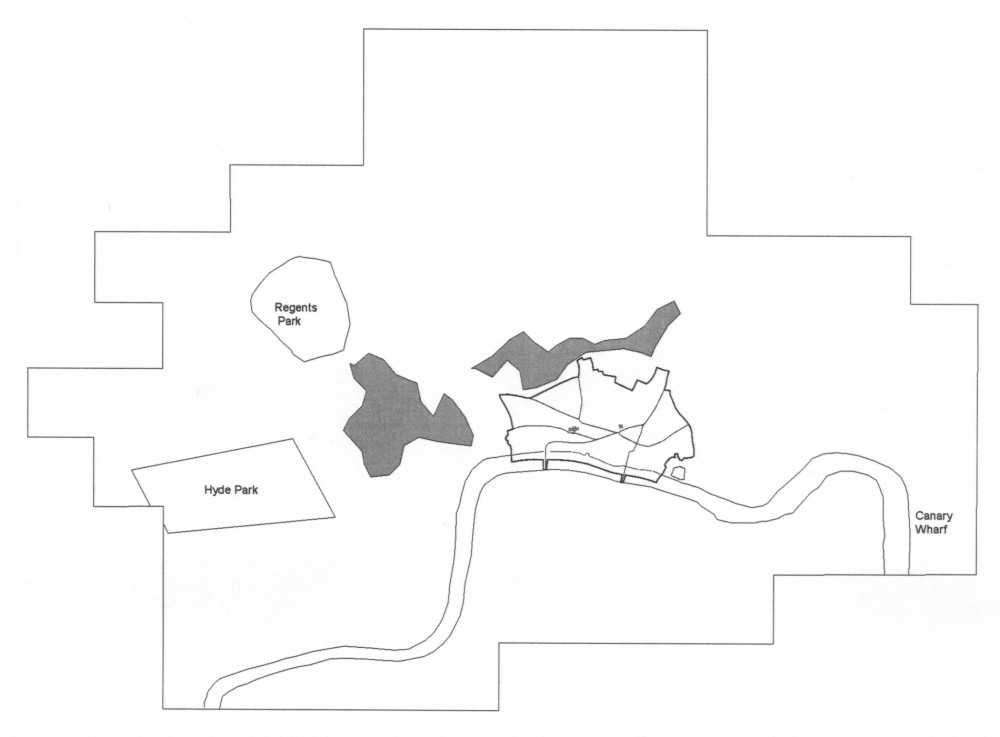
The third map shows cluster zones. These were identified manually as areas in which there is a continuous patch of clustered firms. These were not drawn for all sectors since some exhibit no such zones.
The end result is an atlas of 39 maps covering 14 service sectors across central London: