One way of interpreting the GaWC project is that it is putting geography into globalisation. Globalisation is much more than a ‘new’ scale of activities, it is importantly a new spatial patterning of activities.
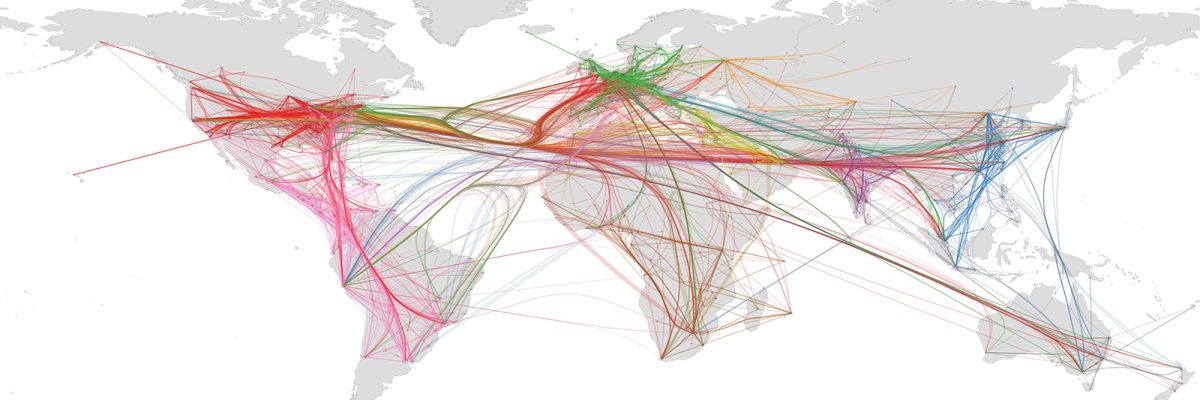
GaWC visualisations capture different aspects and interpretations of how cities operate within contemporary globalisation. They include work by GaWC researchers and by contributors to GaWC who explore related aspects of inter-city relations.